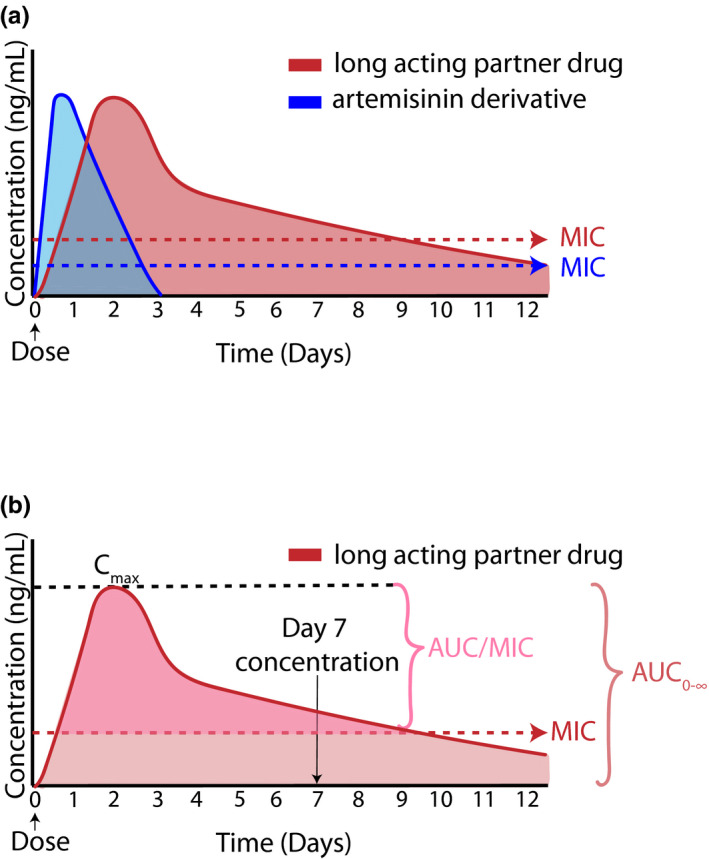
Figure 2.

Pharmacokinetic profile of ACTs. (a) Schematic representation of the plasma profile of both artemisinin and long‐acting partner drug. Although the artemisinin is quickly eliminated, the partner drug has elevated concentrations able to kill parasites for a much longer period of time. (b) Pharmacokinetic markers predictive of treatment outcome. Both day 7 concentration and the area under the concentration time curve (AUC) are associated with malaria treatment outcomes. The Cmax represents the maximum concentration and the minimum inhibitor concentration able to kill parasites is the MIC. Concentration and MIC are set to arbitrary values.
