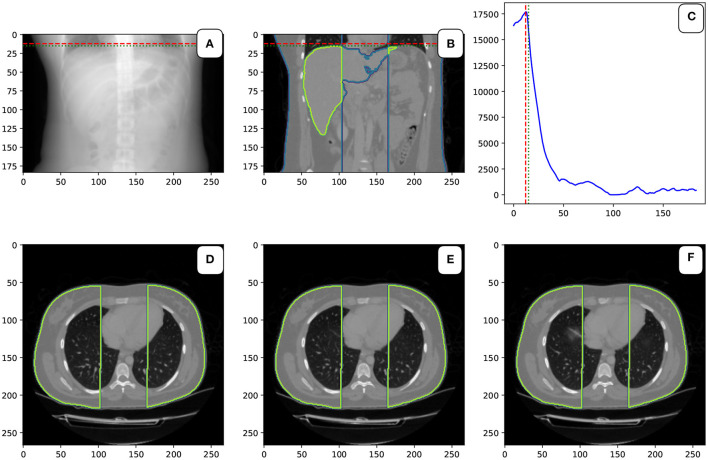
Figure 4.
Localization of the top of the diaphragm: Image (A,B) in the first row show the CT scan's coronal view. The green and blue delineation show the liver and the mask. The red dashed line is the detected level of the top of the diaphragm. The green dashed line shows the top level of the liver. The image (C) in the first row is the plot with the area of the masked cavity in square mm. Images (D–F) show three consecutive axial slides of the CT scan. In the middle (E) is the slice from the top level of the diaphragm can. On the left (D) is the slice above the diaphragm. The right image (F) shows the slide under the top level of the diaphragm. A small “shadow” of the diaphragm can be seen in this image.

