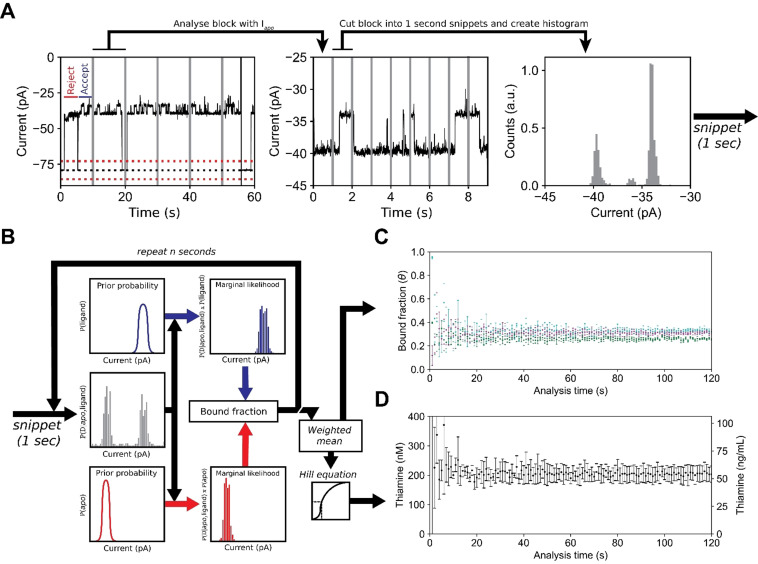
Figure 4.
Real‐time detection of the thiamine (ThOH) concentration in a urine sample using Y27A‐Thiamine binding protein‐equipped ClyA‐AS nanopore. A) Current trace showing the capture of Y27A‐TbpA (blockades) by the ClyA‐AS nanopore. The trace is divided into snippets of 10 seconds and analysed for blockades. The blockades are further analysed and divided into snippets of 1 second. For each blockade snippet a histogram is created and used for subsequent analysis. The dotted black line represents the baseline current, and the red dashed lines represent the 3 σ thresholds. The vertical (grey) lines represent the snippets for blockade and bound fraction determination. B) Workflow for real‐time detection. A normalized histogram is created from 1 second (blockade) snippets and the bound fraction for each snippet is calculated. The ligand bound state is indicated in blue and the apo state is represented in red. The weighted mean of the bound fractions is calculated using the inverse slope in ligand concentration as weights. The thiamine concentration is determined from the Hill equation. C) Estimated bound fraction of three independent measurements where 3 % (cyan) or 5 % (magenta/green) of urine were added to the cis compartment. The analysis time is the number of snippets used In (B) (1 s=1 snippet). D) The weighted mean thiamine concentration in nanomolar and ng mL−1 estimated from three independent measurements, see (C).

