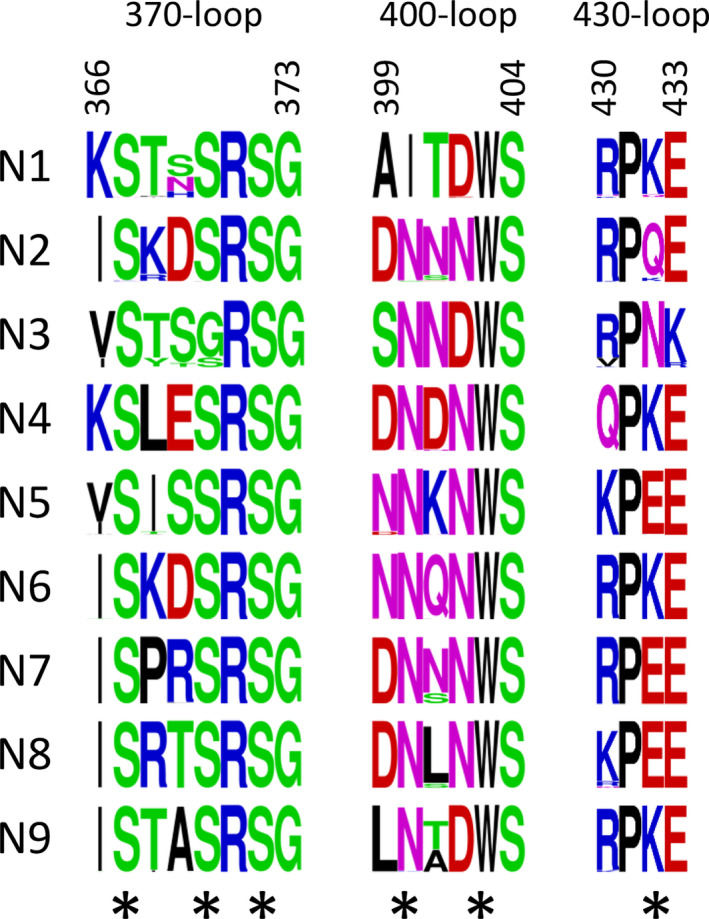
Fig. 3.

Sequence logos of the 2SBS of avian N1–9 NA. Sequence logos were created for the three loops in the 2SBS: 370 loop (residues 366 to 373), 400 loop (residues 399 to 404), and 430 loop (residues 430 to 433) with the WebLogo program (https://weblogo.berkeley.edu/logo.cgi) [55] using all sequences available for avian N1 to N9 NAs in Influenza Research Database (https://www.fludb.org/). For N2 NA, H9N2 viruses were excluded from the analysis. The overall height of the stack represents the sequence conservation at that position, while the height of the symbols within the stack indicates the relative frequency of each amino acid at that position. Asterisks indicate SIA contact residues. Six residues interacting with SIA (SIA contact residues) are labeled with black asterisks.
