
Figure 3.
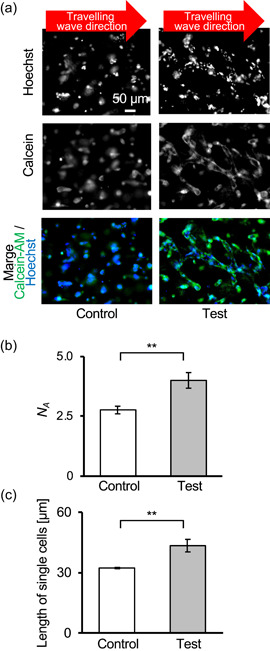
Morphology of cells with acoustic stimulus. Immunofluorescence image of cells (a). The positions where images were taken are shown in Figure S4. The average number of cells, N A, building each vascular network (b) (N = 3, **p < .01, mean ± SD). Note that N is the number of experiments, and each experiment included several cells. Raw data of each experiment are shown in Figure S5. Average length of single cells in each sample (c) (N = 3, **p < .01, mean ± SD). Note that N is the number of experiments, and each experiment included several cells [Color figure can be viewed at wileyonlinelibrary.com]