
Figure 5.
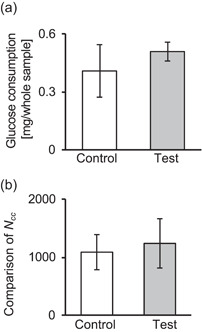
Glucose consumption (a) in culture medium and comparison of the number of cells, N cc, (b) in images of each sample. N cc was normalized to the control (mean ± SD, N = 4)
Official websites use .gov
A
.gov website belongs to an official
government organization in the United States.
Secure .gov websites use HTTPS
A lock (
) or https:// means you've safely
connected to the .gov website. Share sensitive
information only on official, secure websites.
Glucose consumption (a) in culture medium and comparison of the number of cells, N cc, (b) in images of each sample. N cc was normalized to the control (mean ± SD, N = 4)