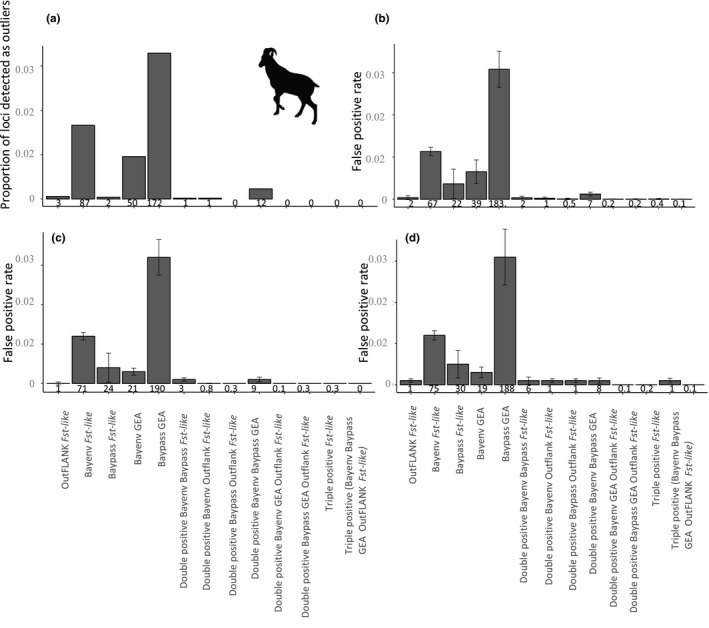
FIGURE 2.

(a) The proportion of SNPs detected by each selection detection method as outliers in the Alpine ibex RADseq SNP set. The absolute number is below each bar. (b) The false positive rate from the fully neutral simulations, (c) 30 QTL loci and (d) 120 QTL loci. Below each bar for b–d is the average number of outlier loci identified
