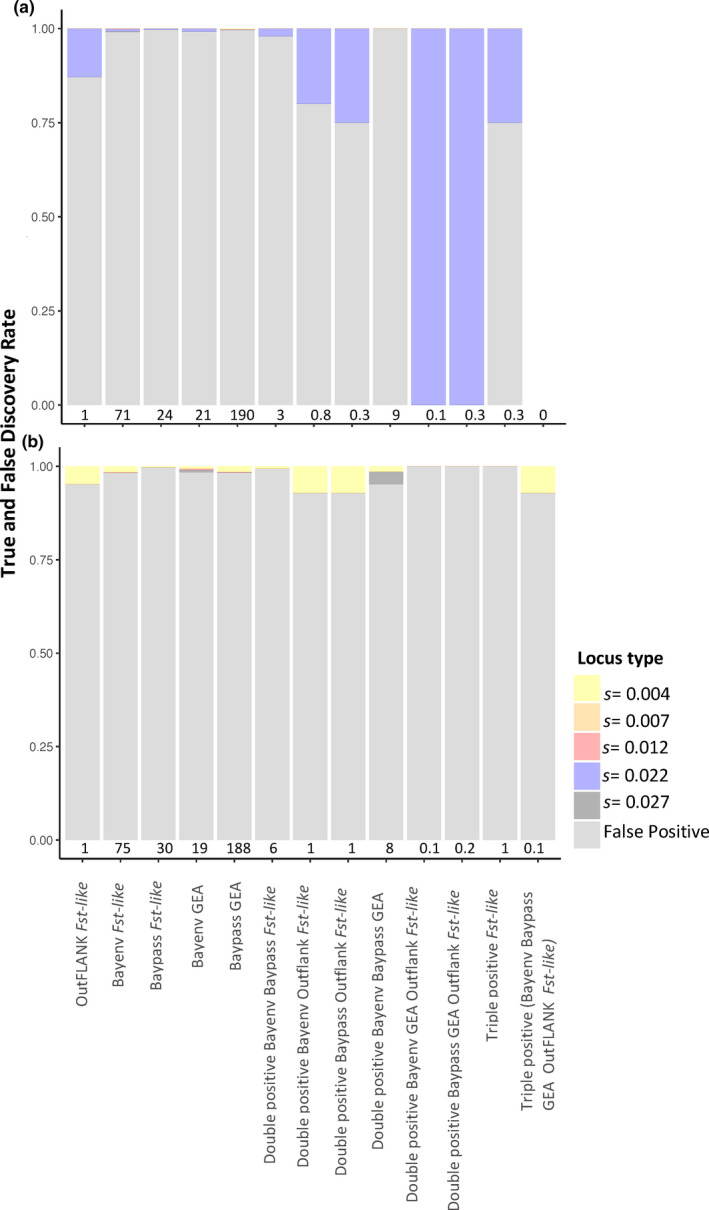
FIGURE 3.

The true and false discovery rate of different selection detection methods for (a) the architecture with 30 loci under selection (six loci per selection coefficient “s”) and (b) the architecture with 120 loci under selection (96 loci at 0.004, six loci for each remaining value). Each bar shows the average composition of loci identified as outliers using each selection detection method, at the bottom of the bar is the average number of outliers across 10 replicate simulations. Replicates where no loci exceeded the significance threshold were excluded from the figure
