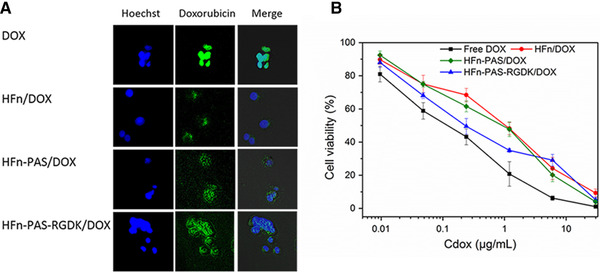
FIGURE 7.

In vitro assessments of DOX loaded HFn and modified HFns. (A) Intracellular distribution images of all groups. Hoechst channel demonstrates the location of tumor cell nucleus by Hoechst 33258 staining of cell nucleus, and doxorubicin channel shows DOX distribution in tumor cells. (B) Anti‐proliferation effects of all groups on MCF7 cells. Data are represented as mean ± standard deviation, n = 3
