FIGURE 2.

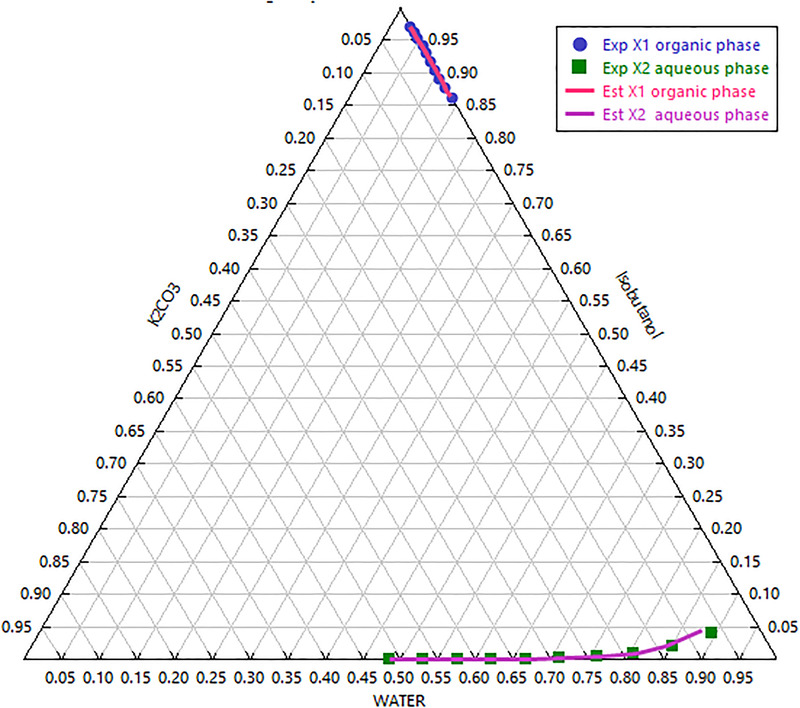
Experimental and estimated triangular phase diagram for isobutanol + K2CO3 + water systems at T = 298.15 K. Experimental tie‐lines (symbol) and the calculated ones(lines)

Experimental and estimated triangular phase diagram for isobutanol + K2CO3 + water systems at T = 298.15 K. Experimental tie‐lines (symbol) and the calculated ones(lines)