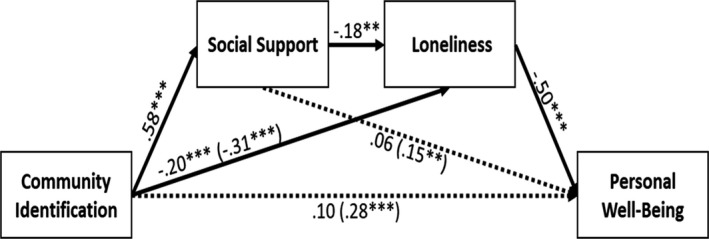
Figure 2.

Study 2a: Path model of the model in Study 2a. Values are standardized. Paths from background variables (age, gender, and marital status) were not reported for purposes of clarity. The dotted line represents a non‐significant path. Direct effects are reported with total effects that are reported in brackets. *p < .05; **p < .01; and ***p < .001.
