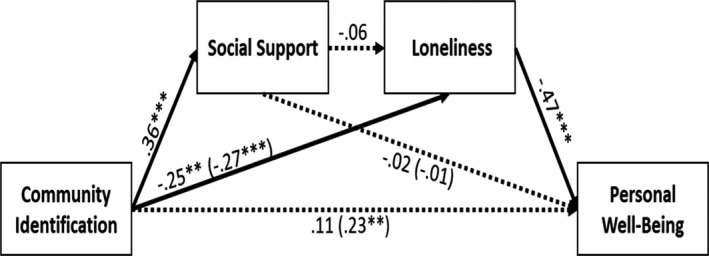
Figure 3.

Study 2b: Path model of the model. Values are standardized. Paths from background variables (age, gender, and marital status) were not reported for purposes of clarity. The dotted line represents a non‐significant path. Direct effects are reported with total effects that are reported in brackets. *p < .05; **p < .01; and ***p < .001.
