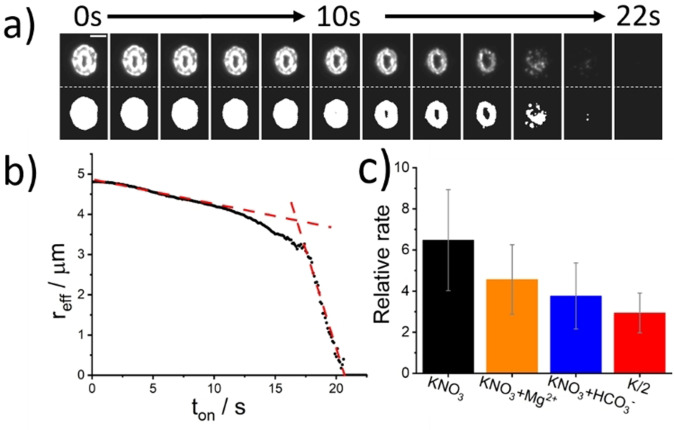
Figure 3.
Opto‐electrochemical dissolution of a representative coccolith from C. braaudii. A potential of +1.2 V (vs. Ag wire) was applied to the working electrode at t on=0 s. a) Temporal evolution of the coccolith optically imaged via dark‐field scatter—top: raw image, bottom: image after auto‐threshold. The coccolith is situated at 45.5 μm from the carbon fibre electrode, measured from the lith centre to the electrode edge. The electrolyte solution was K/2 culture medium with 10 mM H2BQ(aq). The time interval of the images is 2 seconds and the scale bar is 5 μm. b) A plot of the effective radius of the coccolith versus time. c) Dissolution rates measured in different electrolyte medium relative to that predicted for smooth and non‐porous calcite particles (see text). Bars: black −0.7 M KNO3, orange −0.7 M KNO3 + 54.6 mM Mg2+, blue −0.7 M KNO3 + 2.4 mM HCO3 − and red—K/2 culture medium.

