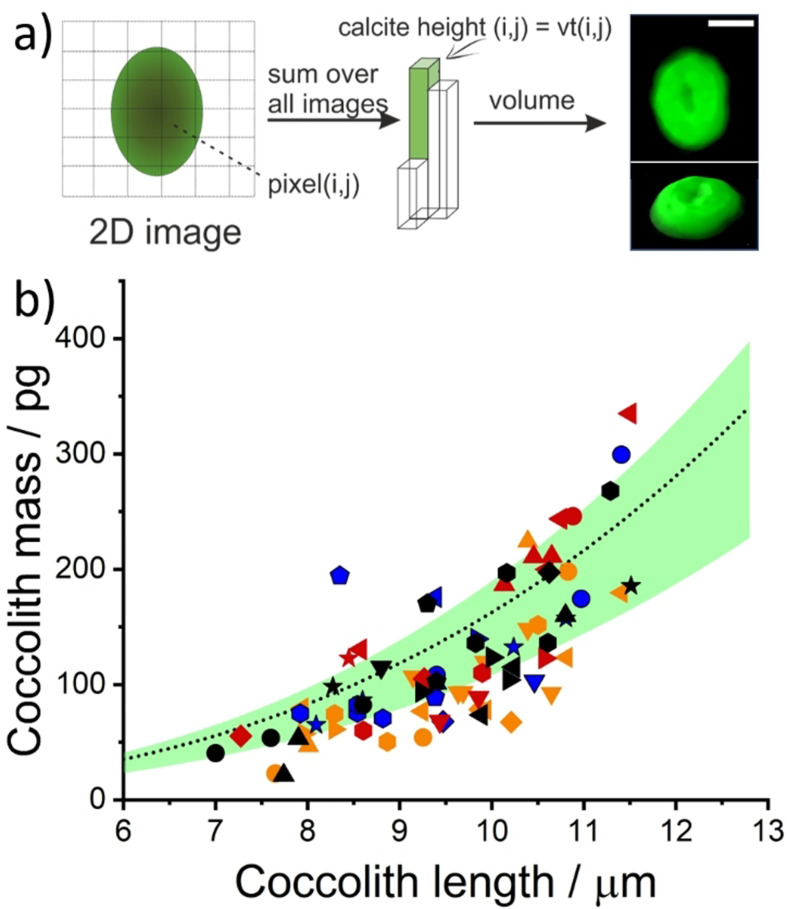
Figure 4.
a) Data analysis procedures leading to the reconstructed representation of a C. braaudii coccolith dissolved in the opto‐electrochemical experiment. Further detail is provided in SI section 2.4. The temporal evolution of this coccolith during acid dissolution is shown in Figure 2 a) with an initial dissolution rate (v=dr eff/dt) of 0.056 μm s−1 as shown in Figure 2 b). The electrolyte is K/2 growth medium with 10 mM H2BQ acid precursor. Scale bar=5 μm. b) A scatter plot showing the estimated mass of C. braaudii coccoliths in various electrolytes, all with 10 mM of H2BQ acid precursor added prior to the experiment. The coccoliths within a distance 10–100 μm from the electrode were analyzed. The colour Scheme representing the electrolyte solution is unchanged from Figure 3 c. The different symbols with the same colour represent data from repeated experiments. The overlaid black dotted line is the estimation of coccolith mass using the recommended shape factor (k s) of 0.06 and green shade is the range of k s values (0.04–0.07) reported by Young et al. [13a]

