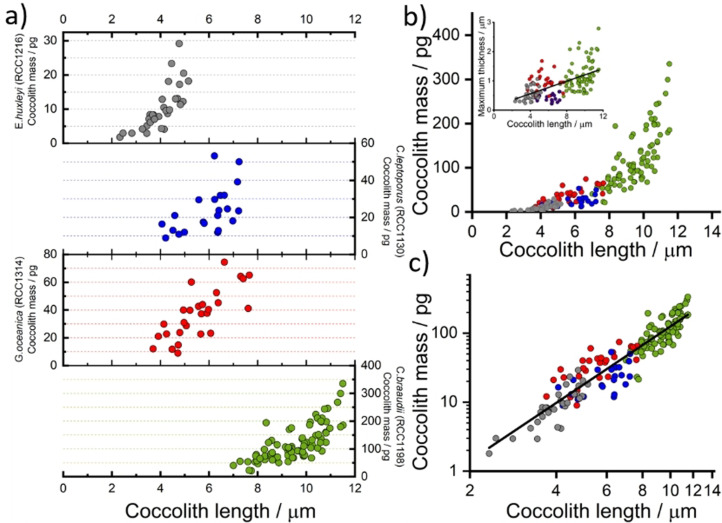
Figure 5.
a) Coccolith mass estimated for individual coccoliths from four different coccolithophore species. b) Collective estimated coccolith mass against coccolith length. Inlay: the maximum thickness of coccolith from image reconstruction, Pearson's r=0.58. c) Collective mass plotted on a logarithmic scale. Circles: grey—E. huxleyi (RCC1216), blue—C. leptoporus (RCC1130), red—G. oceanica (RCC1314) and C. braaudii (RCC1198). Line of best fit over all data: slope=2.78±0.09 and Pearson's r=0.94. The data for E. huxleyi, G. oceanica and C. leptoporus were measured directed from their respective culturing medium with added 10 mM H2BQ acid precursor, whereas those for C. braaudii is the collective data from all four electrolytes as seen in Figure 2 d).

