FIGURE 1.

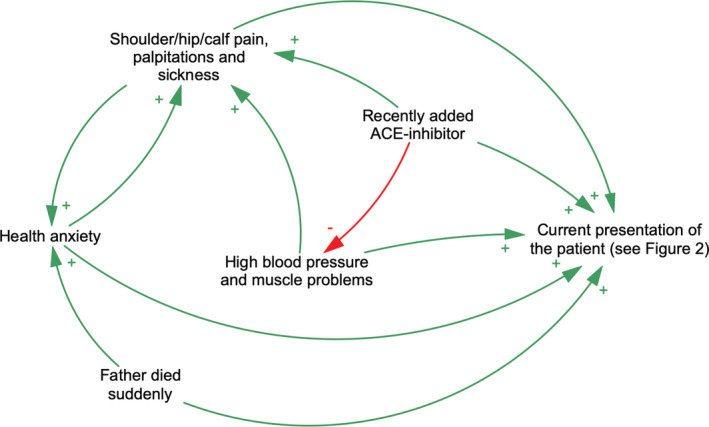
Causal loop diagram of a complexity‐informed approach of a clinical case presentation.Many different factors influence clinical case presentation. They are contributing (+, green) or counteracting (−, red), depending on the context

Causal loop diagram of a complexity‐informed approach of a clinical case presentation.Many different factors influence clinical case presentation. They are contributing (+, green) or counteracting (−, red), depending on the context