
Figure 4.
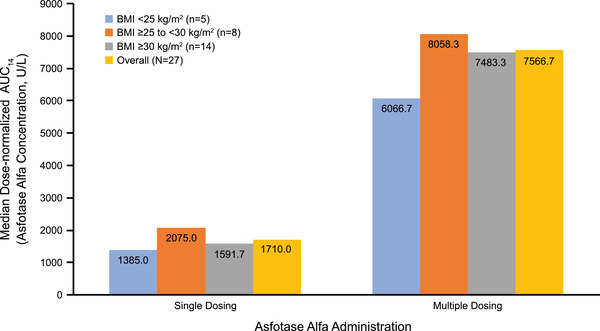
Dose‐normalized median AUC14, categorized by patient BMI categories (<25, ≥25 to <30, and ≥30 kg/m2) after single dose, day 1, and multiple dose, day 61, administration of asfotase alfa. AUC14, area under the concentration‐time curve from time 0 to 14 days; BMI, body mass index.