Figure 5.

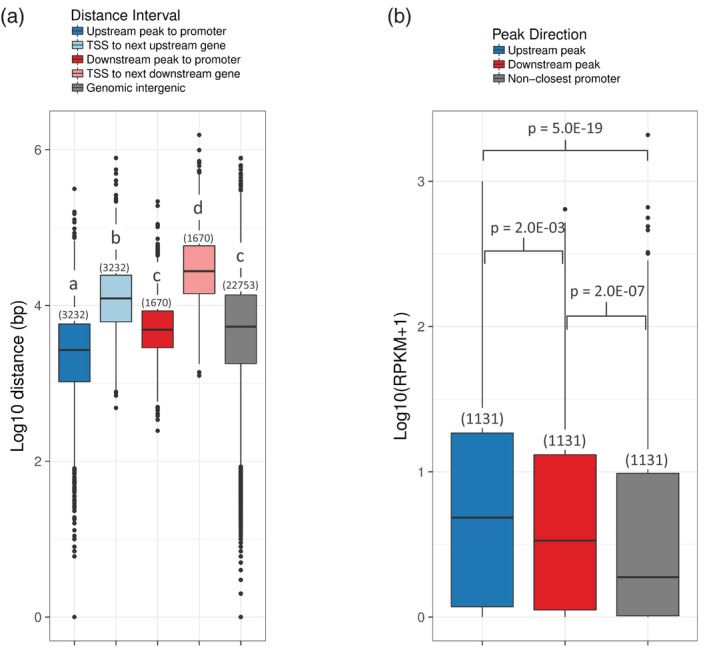
Distance of candidate cis‐regulatory elements (cCREs) to their closest promoter and expression levels of closest genes.
(a) Comparison of the distribution of candidate CRE distances from their nearest promoter for either upstream peaks (dark blue) versus the size of the intergenic interval (light blue) in which they are found or downstream peaks (dark red) versus the size of the intergenic interval in which they are found plus the length of the gene (light red). ‘Genomic Intergenic’ shows the average length of every intergenic interval remaining in the Vitis vinifera genome after subtracting the genes plus their 2‐kb upstream promoters. P‐value determined by an independent pairwise Wilcoxon test. Significant differences (P < 0.05) in promoter distance or intergenic interval length [log10(bp)] between subsets are indicated by unique letters (a–d).
(b) Expression levels of subsets of closest‐promoter genes for which the nearest cCRE is upstream (blue) or downstream (red), or of genes that are not closest to a cCRE (gray). Genes in each group were selected so that each subset had an equal number of genes with a statistically similar length (in bp) distribution. P‐value determined by an independent pairwise Wilcoxon test. Significant differences (P < 0.05) in expression were seen between each subset.
