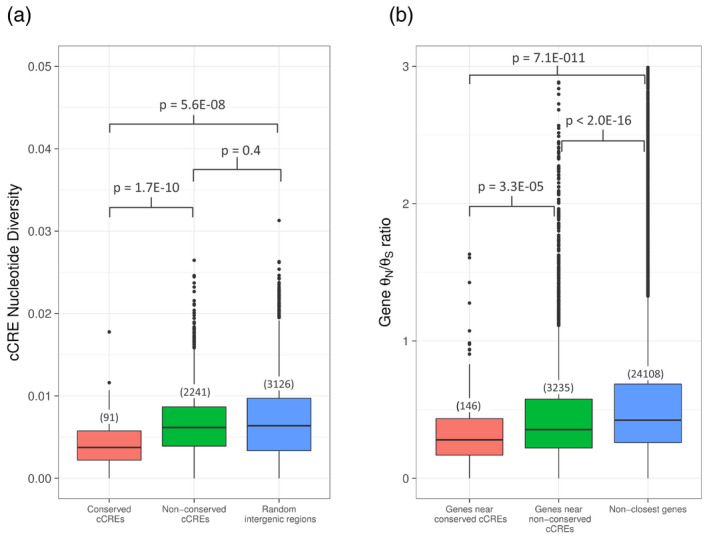
Figure 7.

Conservation levels of candidate cis‐regulatory elements (cCREs) and their closest genes.
(a) Nucleotide diversity of cCREs sharing conservation (red boxplot) or not (green boxplot) with regions in Prunus persica as compared with that of non‐conserved, random intergenic regions (blue boxplot). The number of peaks or regions included in the analysis is listed above each boxplot, and P‐values were determined using an independent pairwise Wilcoxon test.
(b) Rates of non‐synonymous to synonymous (θN/θS) nucleotide substitutions for genes closest to conserved cCREs (red boxplot), non‐conserved cCREs (green boxplot), and genes not closest to a cCRE (blue boxplot). The number of genes included in the analysis is listed above each boxplot, and P‐values were determined using an independent pairwise Wilcoxon test.
