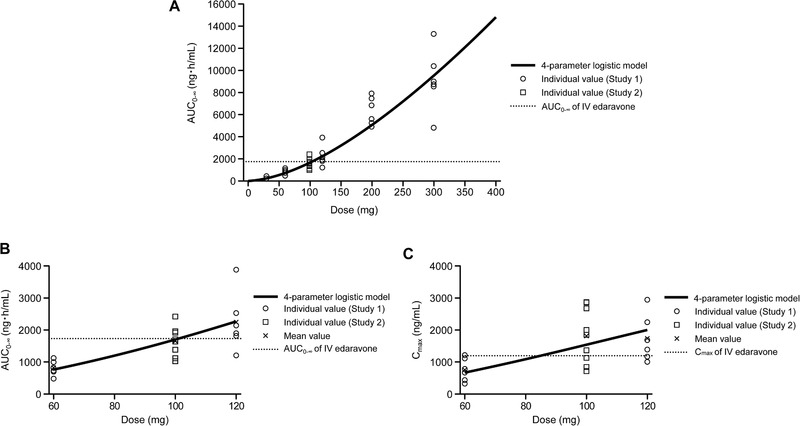
Figure 4.

Mathematical 4‐parameter logistic modeling of area under the curve (AUC) vs edaravone dose (A, B) and maximum plasma concentration (Cmax) vs edaravone dose (C) obtained in pharmacokinetic studies in healthy subjects. (B) shows data magnified from (A). The x‐axis in (C) is also magnified. AUC0‐∞ and Cmax of IV edaravone are the values for the IV formulation of edaravone at a dose of 60 mg/60 min. (A and B) AUC0‐∞ of IV edaravone = 1738 ng·h/mL. (C) Cmax of IV edaravone = 1195 ng/mL. AUC, area under plasma concentration–time curve; AUC0‐∞, AUC from time 0 to infinity; Cmax, maximum plasma concentration; IV, intravenous.
