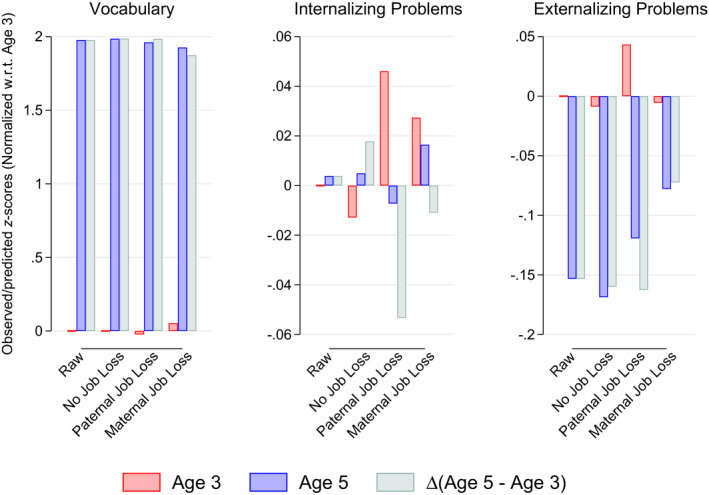
Figure 2.

Observed/predicted z‐scores for each child outcome at ages 3 and 5, together with the corresponding delta. All scores are normalized with respect to the outcome‐specific average at age 3. Raw refers to the observed average scores in the analytical sample, No job loss refers to the predicted scores as per Equation 2 for children that did not experience parental job loss, Paternal job loss and Maternal job loss correspond to the respective predictions as per Equation 2 for children experiencing paternal/maternal job loss.
