FIGURE 4.

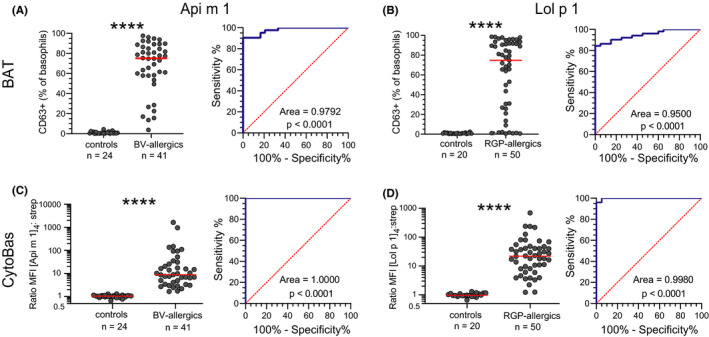
Sensitivity and specificity of BAT and CytoBas for allergy. A) Frequencies of CD63+ basophils following in vitro stimulation with [Api m 1]4 (left) and receiver operator characteristics (ROC) curve of CD63 positivity (right). For each individual, the highest frequency was selected from the serial dilutions in Figure 2B. B) Frequencies of CD63+ basophils following in vitro stimulation with [Lol p 1]4 and ROC curve of CD63 positivity (right). For each individual, the highest frequency was selected from the serial dilutions in Figure 3B. C) Staining intensities as ratio of [Api m 1]4‐APC/streptavidin‐APC on basophils (left) and ROC curve of [Api m 1]4 staining intensity (right). D) Staining intensities as ratio of [Lol p 1]4‐APC/streptavidin‐APC on basophils (left) and ROC curve of [Lol p 1]4 staining intensity (right). Statistics for CD63+ frequencies and allergen tetramer stains, Mann‐Whitney U test; for ROC curves, Wilson/Brown method to test whether the confidence level of the outcome distribution is greater than 95%. **** p < 0.0001.
