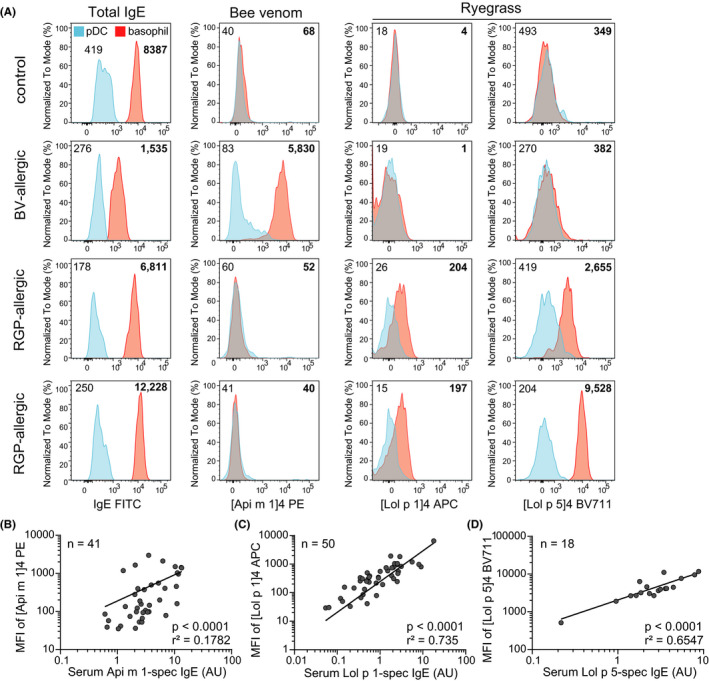
FIGURE 6.

Multiplex flow cytometry distinguishes between different allergic sensitizations with a single tube. A) Representative histograms of [Lol p 1]4, [Lol p 5]4, or [Api m 1]4 MFI on pDCs (blue) and basophils (red) from thawed PBMC of controls, BV‐allergic and RGP‐allergic patients. Numbers accompanying histograms denote MFI (non‐bolded indicate pDCs; bolded indicate basophils). Scatterplots depicting correlation between serum levels of allergen‐specific IgE and MFI of allergen tetramers on basophils stained with B) Api m 1 C) Lol p 1 and D) Lol p 5 allergen tetramers. AU, arbitrary units. Significance and r‐squared (r2) of correlation determined by linear regression.
