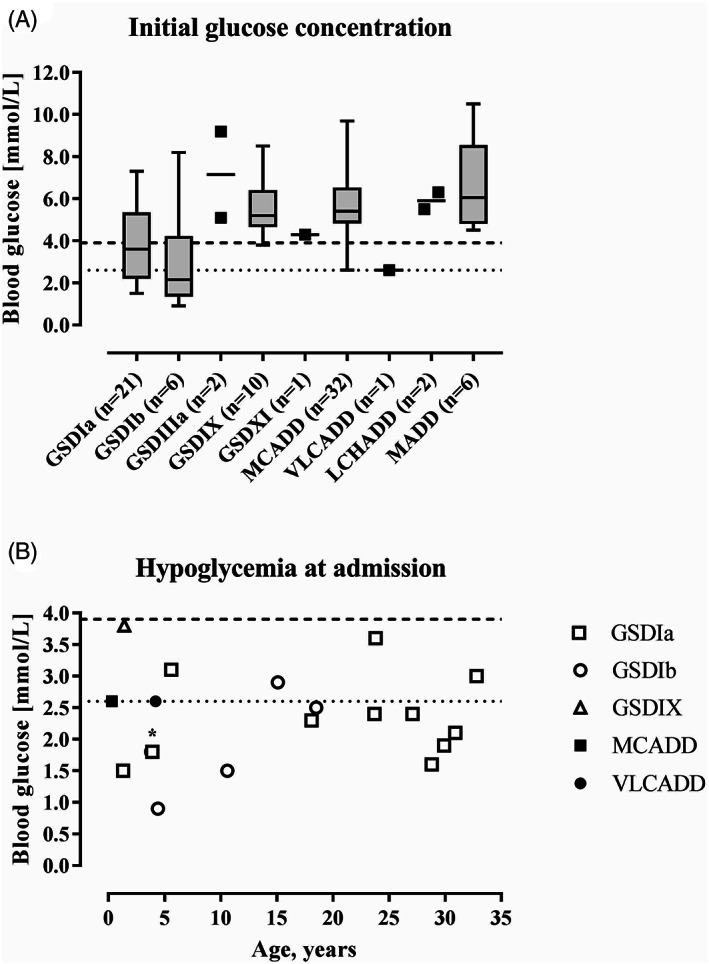
FIGURE 2.

Blood glucose concentrations at hospital admission. A, Initial glucose concentrations at hospital admission per IEM (n = 81). The boxes represent the 25th to 75th percentiles, the whiskers represent the range. B, Characteristics of hypoglycemic glucose concentrations at hospital admission (n = 19). Dashed lines represent the cutoff values for hypoglycemia at 2.6 mmol/L (22) and 3.9 mmol/L (19), respectively. *; data point represents two patients with a glucose concentration of 1.8 mmol/L at the age of 4 years with GSD types Ia and Ib
