Figure 1.
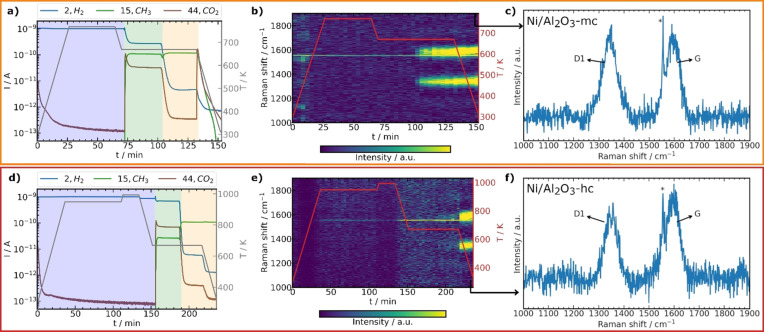
Operando Raman spectroscopy of Ni/Al2O3‐mc (a–c) and Ni/Al2O3‐hc (d–f). a,d) selected mass spectrometry traces during activation (blue), reaction (green) and artificial coking (orange) with temperature (T, gray); cooling in He (white). b,e) 2D plots of Raman spectra (2× binned) with the last spectra highlighted in (c,f) showing formation of carbon (D1 and G bands). * Line feature at 1557 cm−1 in (b,c,e,f) corresponds to O2 from air. [32]

