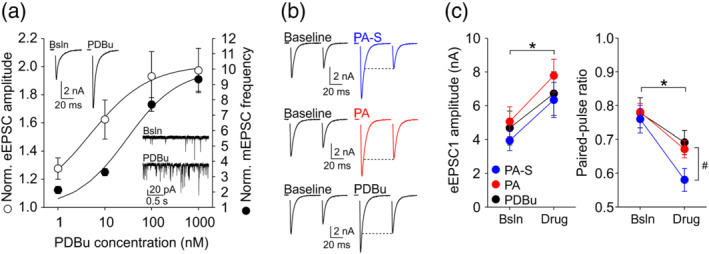
FIGURE 5.

Pregnanolone sulfate (PA‐S) depresses paired‐pulse ratio more strongly than pregnanolone (PA) or phorbol 12,13‐dibutyrate (PDBu). (a) Dose–response analysis of the potentiation of synaptic glutamate release by PDBu. Plot shows mean ± SEM normalized eEPSC amplitude (empty symbols) and normalized mEPSC frequency (filled symbols) in the presence of the indicated PDBu concentrations; n = 4–7. Curves are fits to the data according the equation: normalized value of the parameter = minimum value (set to 1) + [maximum value − minimum value]∕[1 + (EC50/PDBu concentration) h ], where h represents the Hill coefficient and EC50 represents PDBu concentration inducing a half‐maximal effect. For eEPSC amplitude, the fit gave the maximal normalized eEPSC amplitude of 2.01, EC50 = 4.52 nM and h = 0.68. For mEPSC frequency, the fit gave the maximal normalized mEPSC frequency of 9.95, EC50 = 29.92 nM and h = 0.79. Insets show representative eEPSC and mEPSC traces recorded during baseline (Bsln) and in the presence of 100‐nM PDBu. (b) Representative eEPSC traces recorded before and during the application of 100‐μM PA‐S (top), 10‐μM PA (middle) or 10‐nM PDBu (bottom). Note the strong paired‐pulse depression in the presence of PA‐S. (c) Left, mean ± SEM eEPSC1 amplitude before and in the presence of 100‐μM PA‐S (n = 13), 10‐μM PA (n = 12) or 10‐nM PDBu (n = 13). *P <.05, two‐way repeated measures ANOVA (one‐factor repetition), main effect of modulator application. Right, mean ± SEM paired‐pulse ratio before and in the presence of the indicated treatments from the same cells as on the left. *P <.05, two‐way repeated measures ANOVA (one‐factor repetition), main effect of modulator application; # P <.05, interaction between modulator application and experiment (i.e., the type of modulator applied)
