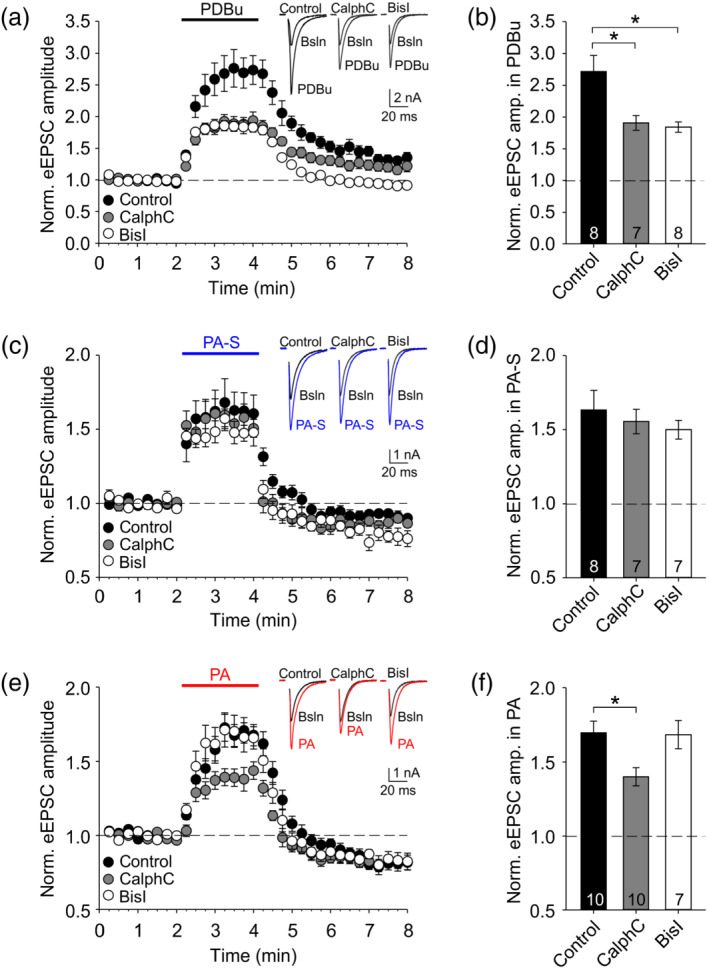
FIGURE 7.

Calphostin C, a blocker of phorbol ester/DAG binding to C1 domains, inhibits eEPSC potentiation by pregnanolone (PA), but not by pregnanolone sulfate (PA‐S). (a) Mean ± SEM normalized eEPSC amplitude from experiments where 100‐nM PDBu was applied after a 15‐min pretreatment and in the continued presence of control extracellular solution (ECS), calphostin C (CalphC; 1 μM) or bisindolylmaleimide I (BisI; 2 μM). Inset shows representative eEPSC traces at baseline (Bsln) and in PDBu from indicated experiments. (b) Summary plot of mean ± SEM eEPSC amplitudes in the presence of 100‐nM PDBu in the indicated inhibitors; n values are as shown. One‐way ANOVA p <.05; *Significant Holm–Sidak post hoc comparison versus control. (c) Mean ± SEM normalized eEPSC amplitude from experiments where 100‐μM PA‐S was applied after a 15‐min pretreatment and in the continued presence of control ECS, calphostin C (1 μM) or bisindolylmaleimide I (2 μM). Inset shows representative eEPSC traces from indicated experiments. (d) Summary plot of mean ± SEM eEPSC amplitudes in the presence of 100‐μM PA‐S in the indicated inhibitors; n values are as shown. (e) Mean ± SEM normalized eEPSC amplitude from experiments where 10‐μM PA was applied after a 15‐min pretreatment and in the continued presence of control ECS, calphostin C (1 μM) or bisindolylmaleimide I (2 μM). Inset shows representative eEPSC traces from indicated experiments. (f) Summary plot of mean ± SEM eEPSC amplitudes in the presence of 10‐μM PA in the indicated inhibitors; n values are as shown. One‐way ANOVA P <.05; *Significant Holm–Sidak post hoc comparison versus control
