FIGURE 4.

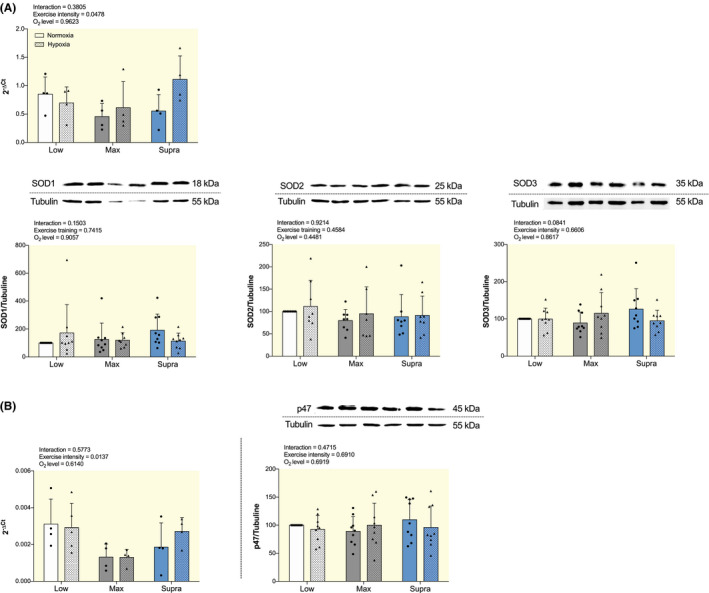
Effect of hypoxic training at different intensities on mRNA and protein expression of markers involved in NO bioavailability in aorta. A, Gene expression analysis of antioxidant SOD3 (top) and Western blot analysis of SOD1, SOD2 and SOD3 protein expression (low). B, Gene expression analysis (left) and Western blot analysis (right) of pro‐oxidant p47phox. For gene expression analysis, results are expressed as 2−ΔCt using 36B4 as housekeeping gene. For western blot analysis, protein expressions were normalized to tubulin content in each sample and expressed as the percentage of the protein expression values obtained in the LowN group. Top panel: representative WB images, and bottom panel: quantitative analysis. Data are presented as mean ± SD (n = 4 to 9 mice per group). Two‐way ANOVA with Sidak post hoc test. Groups: low intensity training group in normoxia (LowN), low intensity training group in hypoxia (LowH), maximal intensity training group in normoxia (MaxN), maximal intensity training group in hypoxia (MaxH), supramaximal intensity training group in normoxia (SupraN), and supramaximal intensity training group in hypoxia (SupraH)
