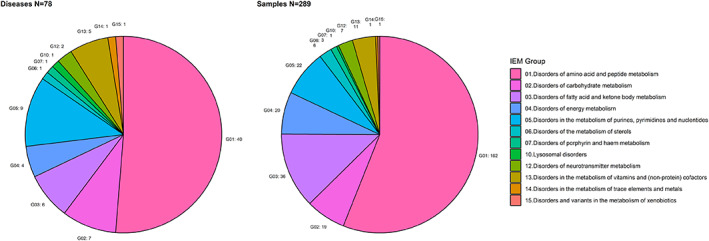
FIGURE 1.

Summary of phenotypes and samples in clinical validation. Diseases are grouped according to the SSIEM classification of Inborn Errors 2011 (http://www.ssiem.org/images/centralstore/resources/SSIEMClassificationIEM2011.pdf). Left: the distribution of the 78 different IEM in the clinical validation. Right: the disease distribution of 289 urine samples in the clinical validation. The number of disease/samples in each group are indicated next to the pie plots
