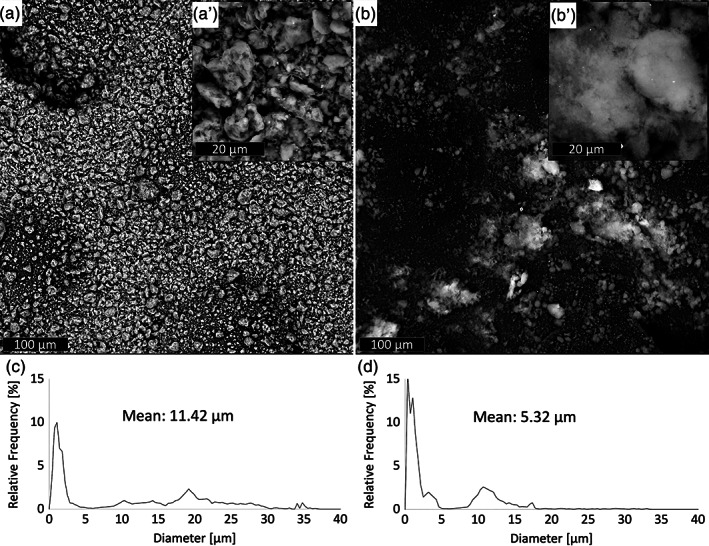
FIGURE 1.

Scanning electron microscopy (SEM) micrographs of (a) clay (CLO) and (b) silica (AS) particles. Particle size distribution of (c) CLO and (d) AS particles. Characterizations of both particles were carried out after 1 hr sonication in TCM:Ac (2:1 vol)
