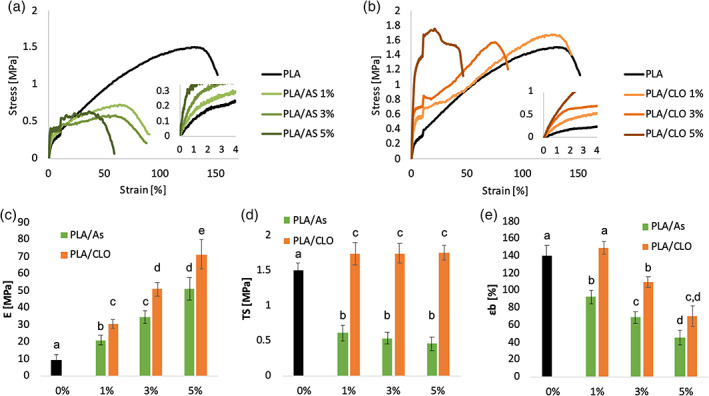
FIGURE 9.

Representative stress–strain curves of (a) polylactic acid/silica (PLA/AS) and (b) PLA/clay (CLO) nancomposites electrospun mats; (c) elastic modulus, (d) tensile strength and (e) elongation at break of PLA/AS PLA/CLO nancomposites electrospun mats as a function of the filler content. Values are given as means ± SD of n = 5 samples. Different letters in the same graph indicate significant differences (p < .05) when analyzed by multiple Student's t test
