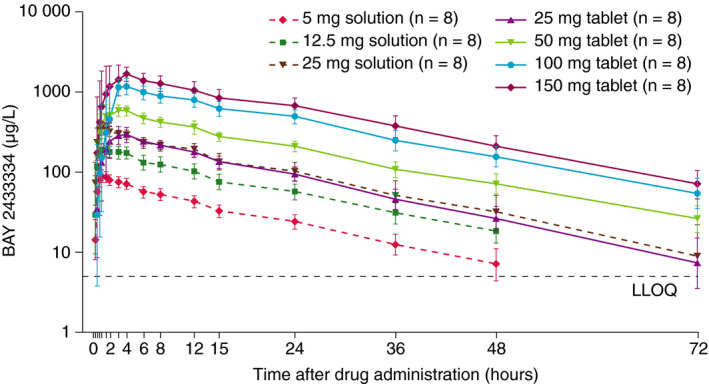
FIGURE 2.

Plasma concentration–time profile of BAY 2433334 in healthy volunteers in part 1. Data are presented as geometric mean. The lower and upper limits of the error bars are geometric mean/geometric SD and mean × geometric SD, respectively. Abbreviations: LLOQ, lower limit of quantification; SD, standard deviation
