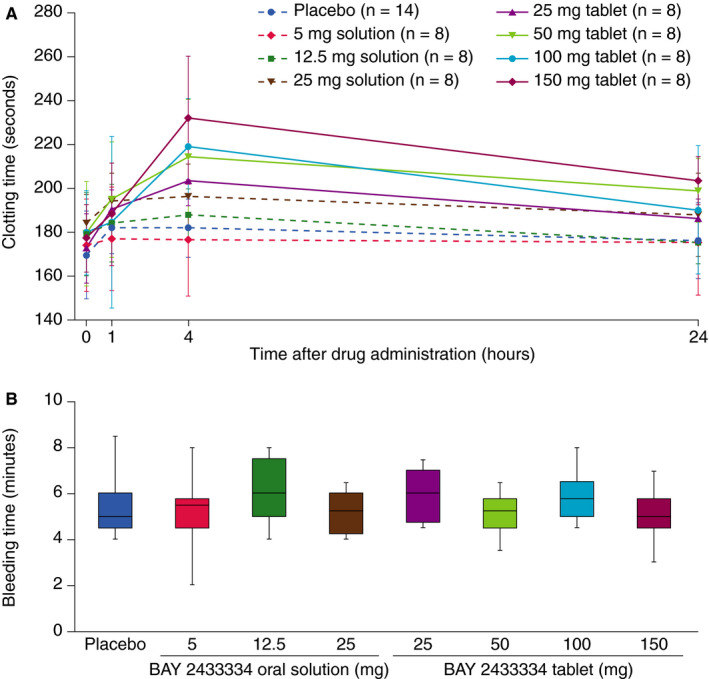
FIGURE 4.

Effect of increasing doses of BAY 2433334 on (A) clotting time measured by rotational thromboelastometry and (B) bleeding time. Bleeding time data were obtained 4 h after drug administration and are presented as box‐and‐whisker plots; upper and lower lines of the box denote the upper and lower quartiles, respectively, midlines denote the medians, and upper and lower lines denote the maximum and minimum values, respectively
