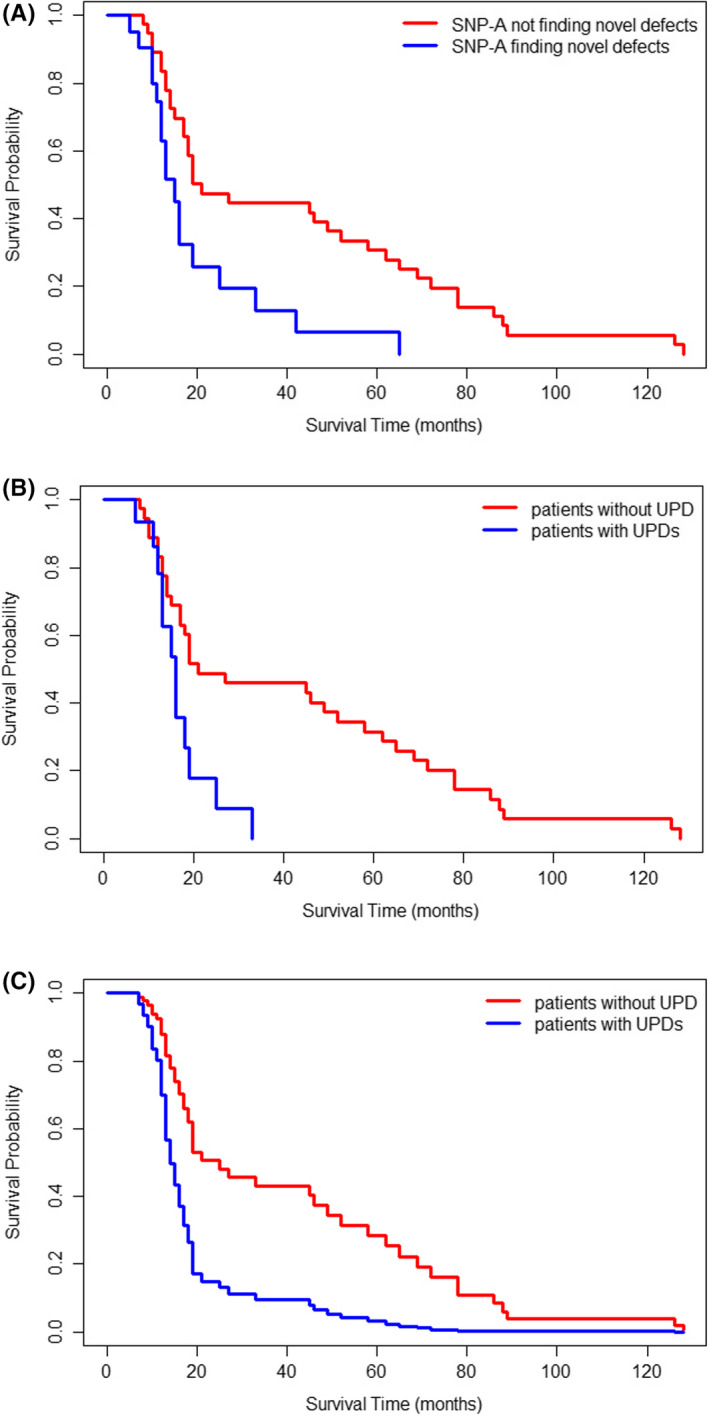
FIGURE 3.

Overall survival (OS) of MDS patients with normal karyotype. A, Survival curves in 41 patients without novel chromosomal defects found by SNP‐A (red line) and 22 patients with novel chromosomal defects found by SNP‐A (blue line) using the KM method (P = .003). B, Survival curves in 41 patients without chromosomal structural abnormalities or UPDs (red line) and 15 patients with UPDs (blue line) using the KM method (P = .008). C, Survival curves in 41 patients without chromosomal structural abnormalities or UPDs (red line) and 15 patients with UPDs (blue line) using the COX multivariate regression model (adjusted for the average age, P = .01)
