
FIGURE 1.
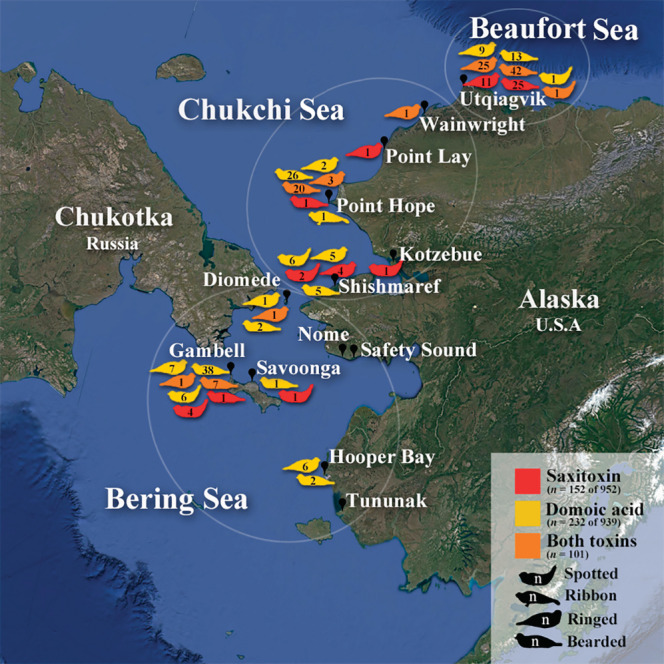
Harvest locations (black pins) are shown within circles indicating regional classifications (Bering, Chukchi, and Beaufort Seas). Next to each harvest location, icons represent the number of each seal species that tested positive for DA (yellow), STX (red), and both toxins (orange). Map generated in Google Earth.