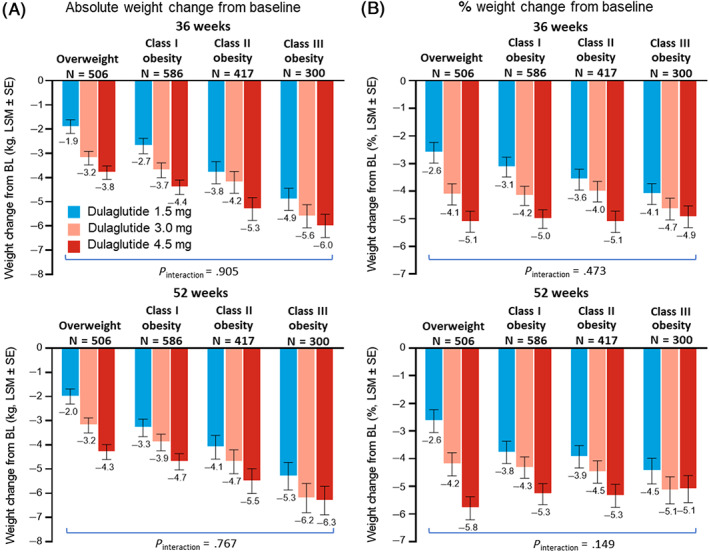
FIGURE 2.

Change in weight by clinically relevant baseline body mass index (BMI) subgroup. A, Absolute change in weight by baseline BMI subgroup at 36 weeks (top) and 52 weeks (bottom), MMRM. B, Percentage change in weight by baseline BMI subgroup at 36 weeks (top) and 52 weeks (bottom), MMRM. All analyses included data collected up to either initiation of any new antihyperglycaemic medication for more than 14 days (regardless of whether the investigator indicated that it was for severe persistent hyperglycaemia) or premature treatment discontinuation, whichever occurred first. N, patients with non‐missing baseline value and at least one non‐missing postbaseline value of the response variable. P values are for treatment‐by‐subgroup interaction evaluated using a significance level of .10, unadjusted. BL, baseline; ETD, estimated treatment difference versus dulaglutide 1.5 mg; LSM, least‐squares mean; MMRM, mixed model for repeated measures; SE, standard error
