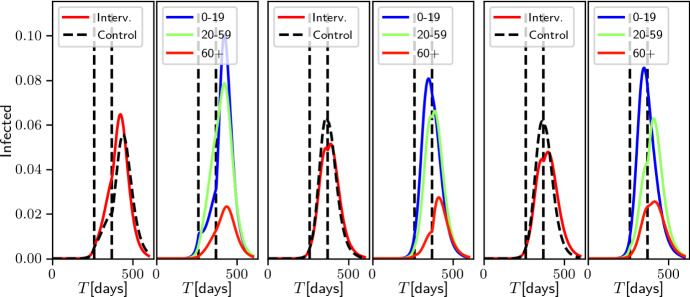
Fig. 9.
Impact of zeroing school (left), work (middle) and other (right) components when each age group has the same number of individuals and each component contributes the same number of contacts. For each, left panel shows the total prevalence of infected individuals in the population using the intervention (red) and the control (scaling of the entire contact matrix to achieve the same effective , in black). The right panel shows the prevalence of infected in three pooled age groups chosen to reflect the target of each intervention

