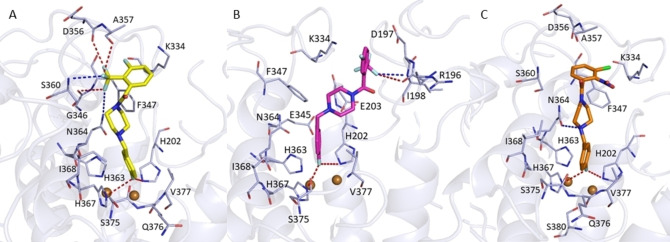
Figure 6.
Plausible binding modes for inhibitors 23 (Panel A), 25 (Panel B) and 26 (Panel C) into hTYR binding site. Compound 23 is displayed as yellow sticks, while compounds 25 and 26 are represented as magenta and orange sticks, respectively. The amino acid residues of the binding site are represented by light‐blue sticks. H‐bonds are displayed as blue dashed lines whereas halogen bonds are highlighted as red dashed lines. The image was created by using PyMOL software (www.pymol.org).

