Figure 2.
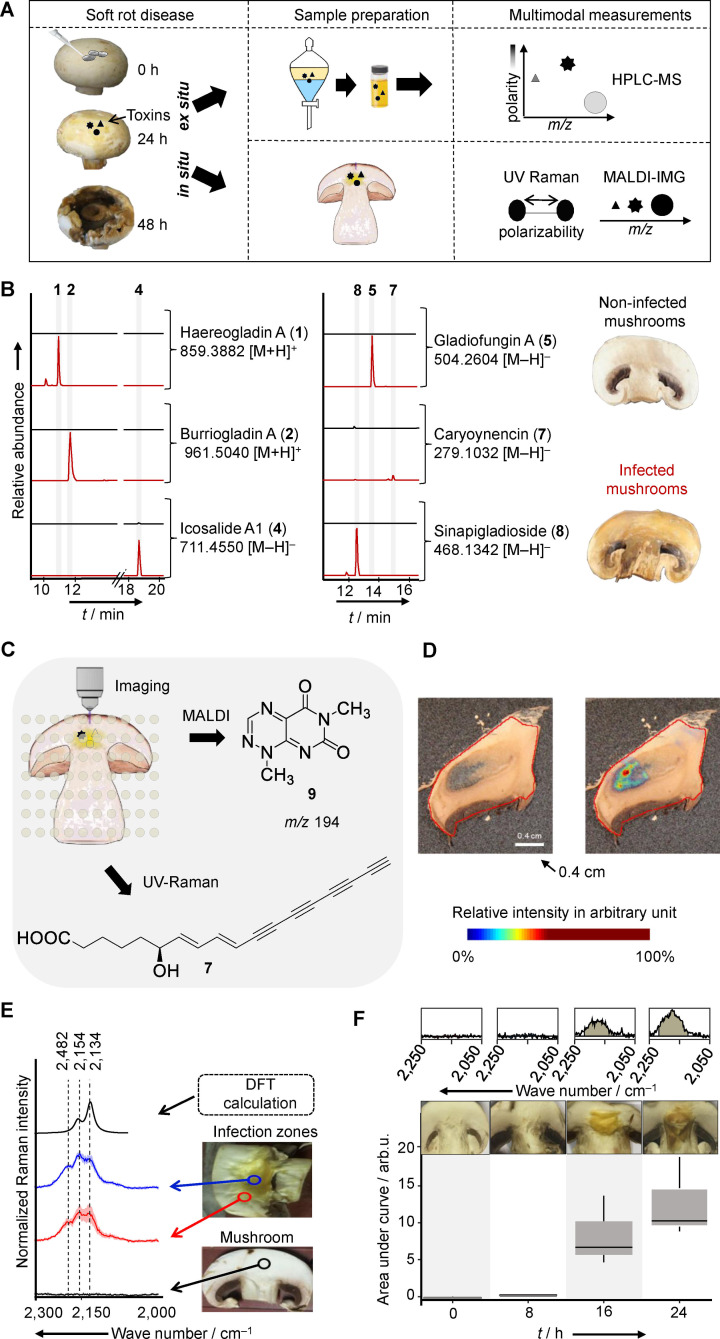
Multimodal identification of virulence factors involved in the soft rot disease. A) Workflow of B) organic phase extraction and LC–MS analysis (extracted ion chromatograms of crude extract of infected (red) and non‐infected (black) mushroom), and C) imaging of infected mushroom slices. D) MALDI imaging of infected mushroom tissue, visualization of m/z 194 Da [M+H]+(right). E) DFT calculated and measured UV Raman spectra of 7. Measurements carried out on mushrooms slices: non‐infected (black), infected (blue/red). F) Box plots of the area under the curve of the Raman spectral band region associated with 7 (2,120–2,220 cm−1) of infected mushroom tissue at different time points. Each box plot shows the distribution of integrated Raman intensities of three subsequent measurements of mushroom slices at various incubation times.

