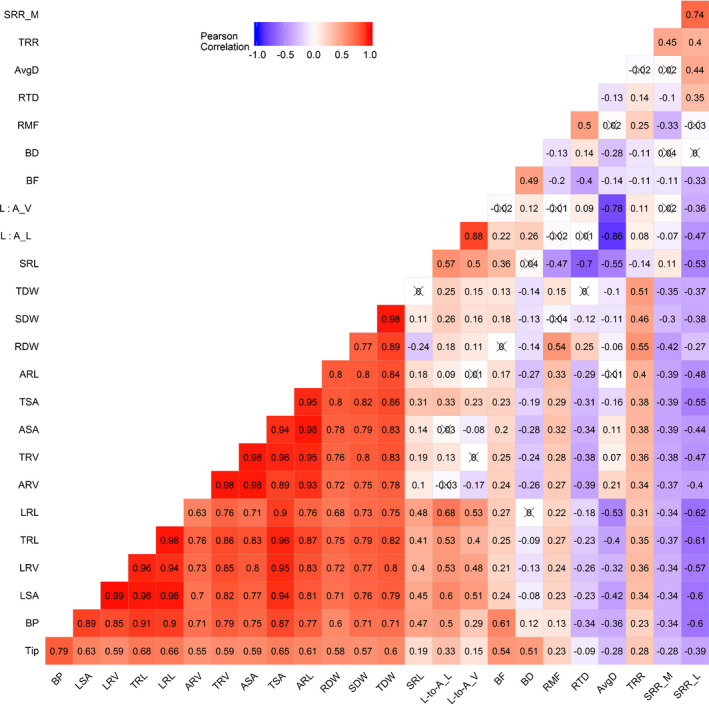
Fig. 3.

Pairwise Pearson correlation for selected traits of the Triticeae Coordinated Agricultural Project (T‐CAP) winter wheat seedlings. The numbers represent the correlation values. The cross symbol (×) means that the correlation value is not significant at P < 0.05. Bright red to bright blue indicates highly positive to highly negative correlations. Traits were measured in winter wheat. ARL, axial root length; ARV, axial root volume; ASA, axial root surface area; AvgD, average root diameter; BD, branching density; BF, branching frequency; BP, number of branch points; LRL, lateral root length; LRV, lateral root volume; LSA, lateral root surface area; L : A_L, lateral : axial root length ratio; L : A_V, lateral : axial root volume ratio; RDW, root dry weight; RMF, root mass fraction; RTD, root tissue density; SDW, shoot dry weight; SRL, specific root length; SRR, specific root respiration; SRR_L, SRR per root length; SRR_M, SRR per root mass; SRR_R, SRR residual; TDW, total dry weight; Tip, number of root tips; TRL, total root length; TRR, total root respiration; TRV, total root volume; TSA, total root surface area.
