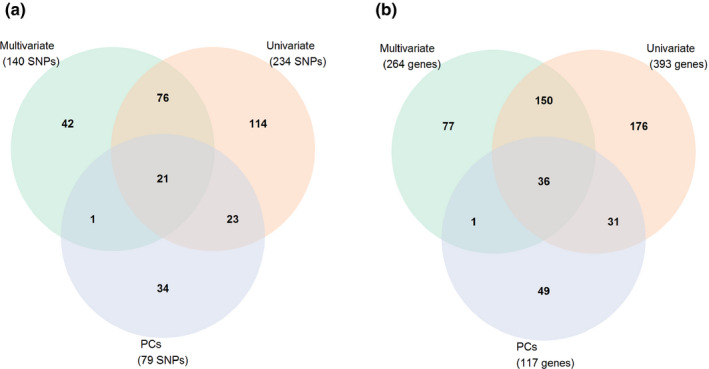
Fig. 6.

Venn diagrams of (a) associated single nucleotide polymorphisms (SNPs), with a cutoff threshold set at –log10P = 3.5, (b) genes identified with a cutoff set at –log10P = 3.5.In (a) and (b, diagrams depict the significant results for: univariate analysis of 25 traits, univariate analysis of 10 principal components (PCs), and multivariate analysis of six trait combinations.
