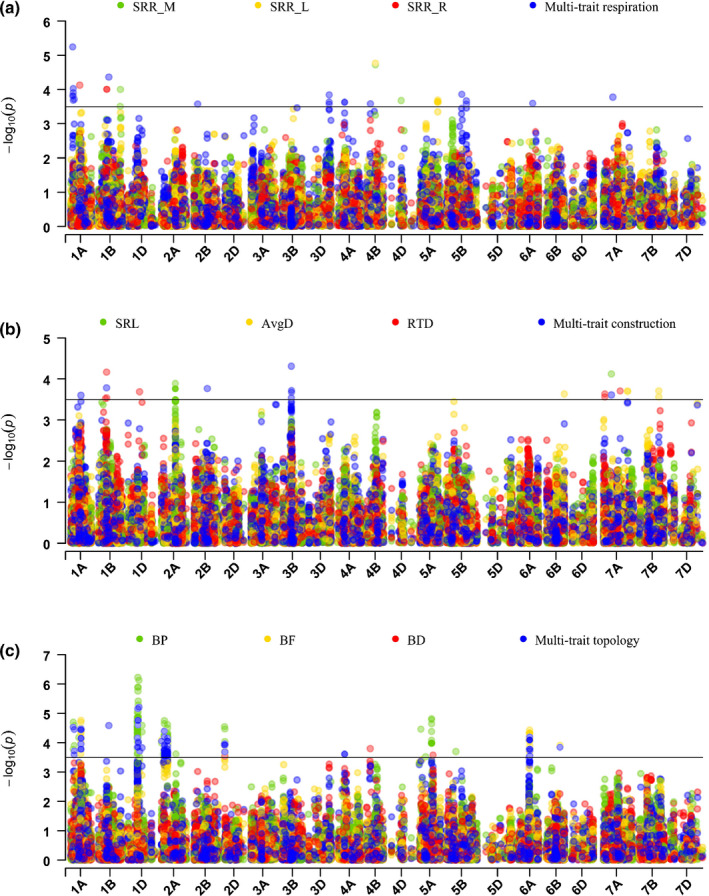
Fig. 7.

Manhattan plot of genome‐wide association study (GWAS) analyses conducted for the following traits: (a) Specific root respiration (SRR) by mass, SRR by length, residuals of total respiration vs volume of different segments, and multi‐trait combination for root respiration. (b) Specific root length (SRL), average root diameter (AvgD), root tissue density (RTD), and multi‐trait combination for root construction. (c) Number of branch points (BP), branching frequency (BF), Branching density (BD), and multi‐trait combination for root topology of the Triticeae Coordinated Agricultural Project (T‐CAP) winter wheat population. Each dot represents a single nucleotide polymorphism (SNP). The horizontal black line indicates the threshold of significance at –log10P = 3.5.
