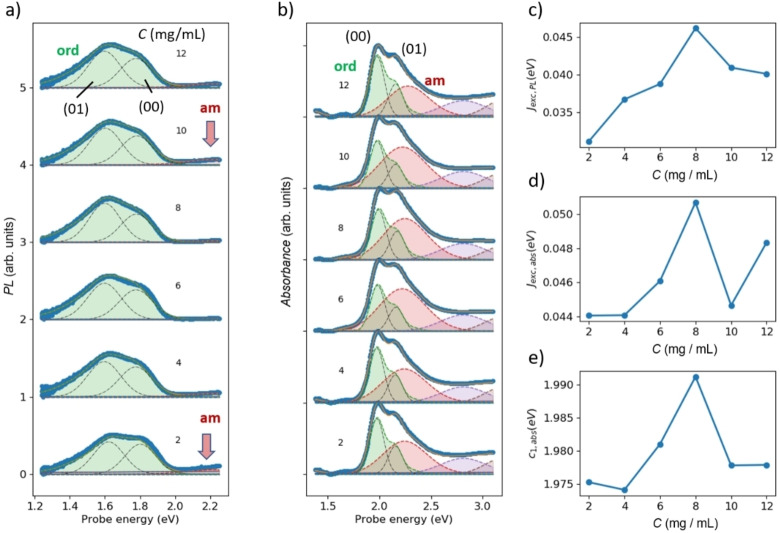
Figure 3.
PL (a) and UV/Vis (b) spectra of samples obtained from PM6 solutions in the green solvent o‐xylene at different concentrations with 2, 4, 6, 8, 10, and 12 mg mL−1 ordered by the relative amount of the (00) PL transition at 1.8 eV. The concentration is given in panel (b) in mg mL−1. Blue symbols are experimental data points, blue lines are spectral fits obtained by superposition of electronic contributions (orange lines), a horizontal baseline (green line) and a line with positive slope (red line). Dashed orange lines with shaded areas are contributions (from right) of ordered phase, amorphous phase, higher electronic transitions. c) Excitonic coupling, obtained by Equation (S1) (see Supporting Information) from the relative reduction of the (00) transition in panel (a); d) same for panel (b); e) corresponding center energy of the (00) transition in panel (b).

