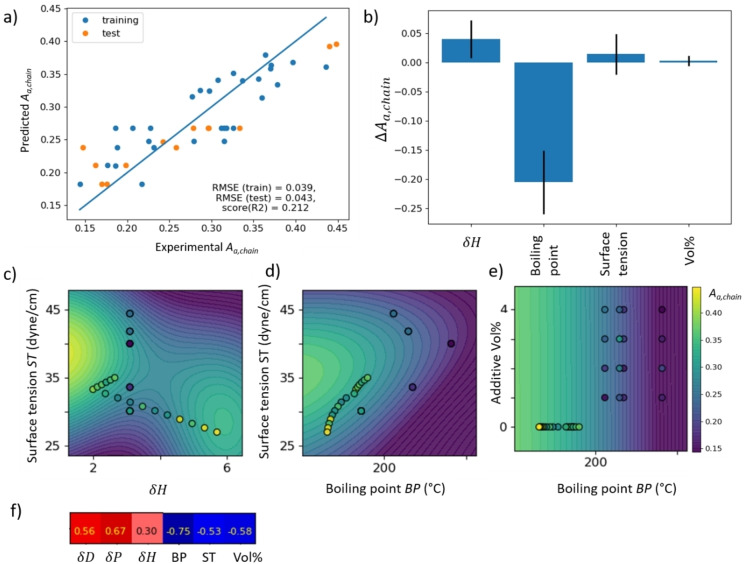
Figure 4.
GPR to predict the amount of amorphous phase from the Hansen solubility parameter δH, the boiling point and the surface tension. a) Result plot; b) feature importance; c–e) approximate objective function as predicted by GPR (coloured hypersurface) and experimental data (points). The color bar on the right refers to both data points and hypersurface in panels (c)–(e). For comparison, panel (f) shows the Pearson correlation for selected features with A a,chain.

