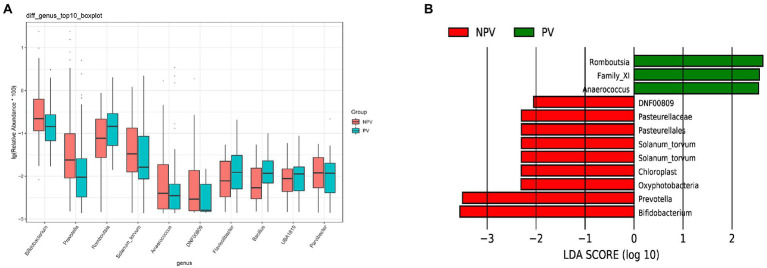
Figure 6.
Differences in the vaginal microbiota between pregnant and non-pregnant groups. (A) Boxplot of the top 10 genera in the differential genera between the two groups. (B) Linear discriminant analysis to explore potential genera in vagina contributing to intergroup differentiation. The green bar indicates the genera contributing to the pregnant group, while the red bars indicate the genera contributing to the non-pregnant group.

