
FIGURE 6.
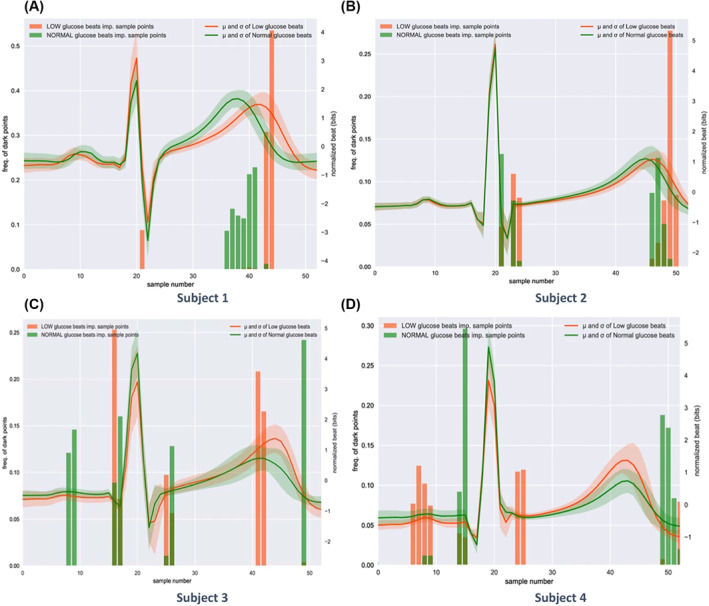
Illustration of interindividual differences in heartbeats during hypoglycaemia events. The solidlines represent the mean of all the heartbeats that correspond to each subject in the training dataset: green during normal glucose levels, red during hypoglycaemic events. The comparison among four different subjects highlighted the fact that each subject may have a different ECG waveform during hypoglycaemic events. For instance, Subjects 1 and 2 present a visibly longer QT interval during hypoglycaemic events, differently from Subjects 3 and 4. Reproduced from Porumb et al. 129