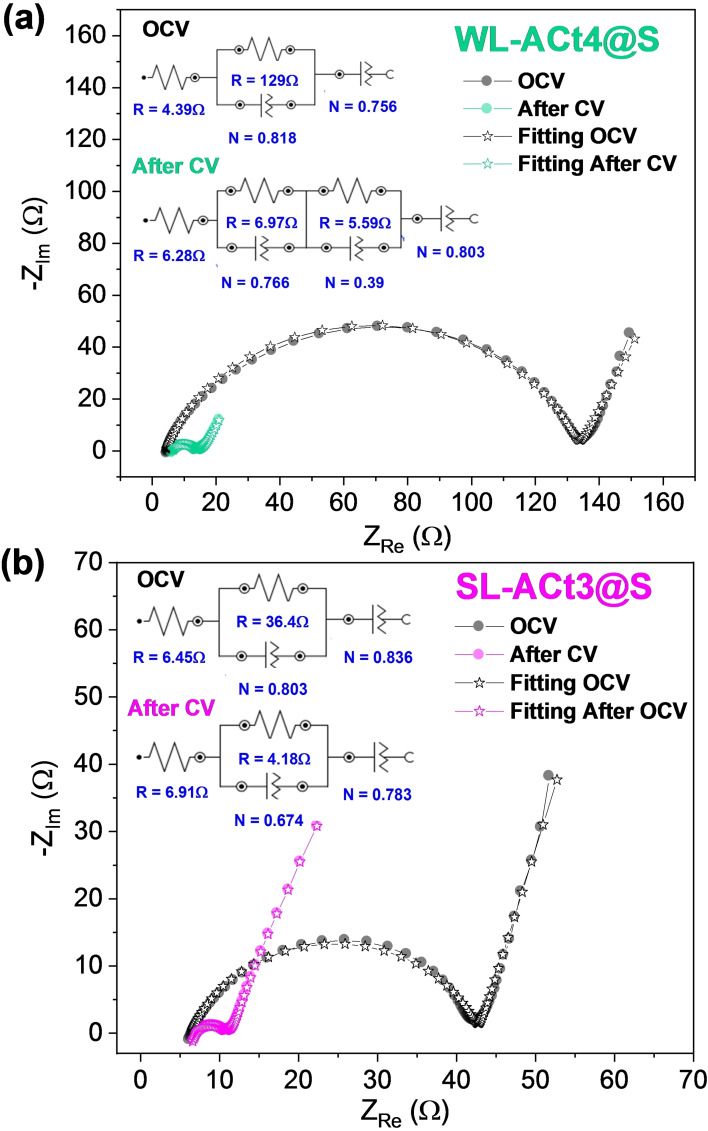
Figure 7.
Nyquist plots recorded by EIS at OCV of the cell and after 3 cycles of CV at 0.1 mV s−1 for (a) Li/1 m LiTFSI(DOL/DME)/WL‐ACt4@S and (b) Li/1 m LiTFSI(DOL/DME)/SL‐ACt3@S cells. The fitting results are shown together with the equivalent circuits in the inset for OCV and after the third CV cycle.

