FIGURE 3.

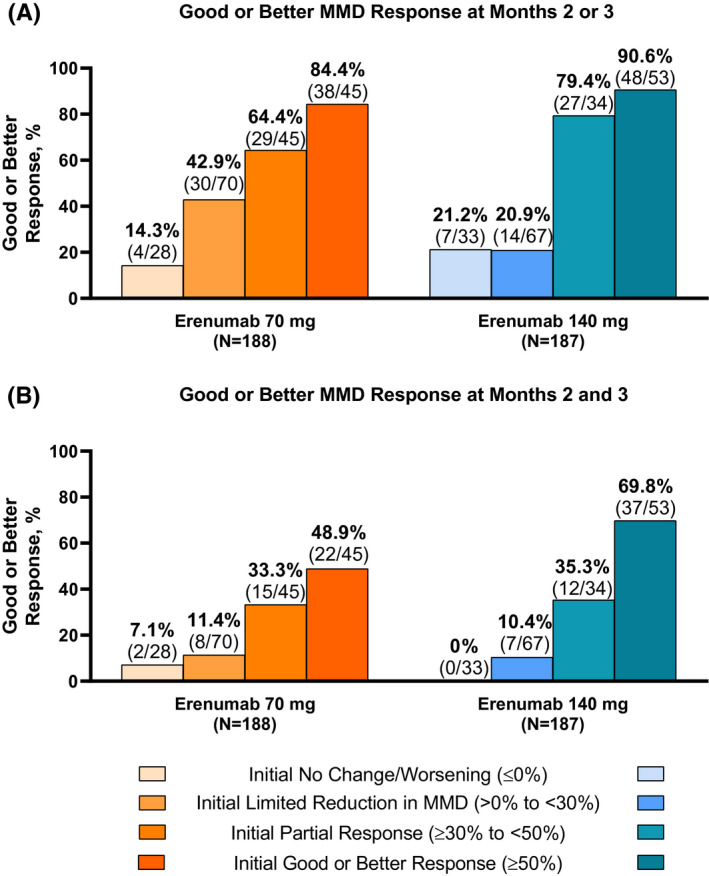
Patterns of continued and delayed response by the level of initial response at Month 1 after treatment with erenumab 70 and 140 mg. (A) Response at Month 2 or 3. (B) Response at Months 2 and 3. MMD, monthly migraine day

Patterns of continued and delayed response by the level of initial response at Month 1 after treatment with erenumab 70 and 140 mg. (A) Response at Month 2 or 3. (B) Response at Months 2 and 3. MMD, monthly migraine day