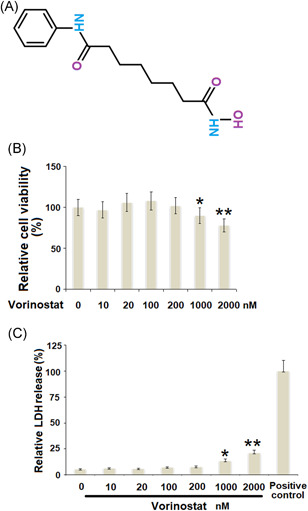
FIGURE 1.

Effects of vorinostat on cytotoxicity in human T/C‐28a2 cells. (A). Molecular structure of vorinostat. (B). Cells were stimulated with vorinostat at the concentrations of 0, 10, 20, 100, 200, 1000, and 2000 nM for 24 h. Cell viability was measured using the MTT assay (C). Cells were stimulated with vorinostat at the concentrations of 0, 10, 50, 100, 200, 1000, and 2000 nM for 24 h. LDH release was measured using a commercial kit with the 0.1% Triton X‐100 treatment group as a positive control (N = 5–6, *p < 0.05, **p < 0.01 vs. the vehicle group). LDH, lactate dehydrogenase; MTT, 3‐(4,5‐dimethylthiazol‐2‐yl)‐2,5‐diphenyltetrazolium bromide
