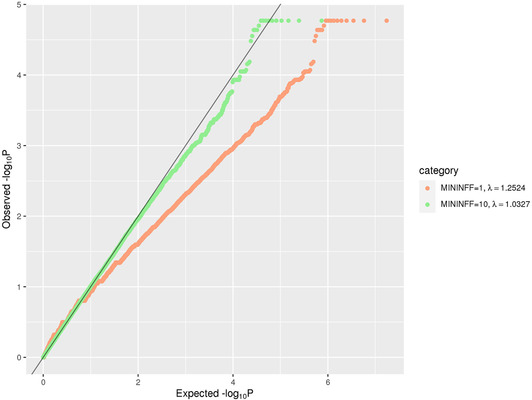
FIGURE 2.

QQ plot of rare (MAF < = 1%) single‐variant association results in the family‐based discovery data set (NIMH and NIA cohorts). The red line corresponds to all statistics, where at least one informative family is observed. The green line corresponds to statistics with at least ten informative families
